Agency
Radiant Digital
Client
Verizon (2022-23)
Role
Lead user experience, interface, and visual designer
Services
User experience research, information architecture, visual design, user interface design, data visualization
Network Topology Visualizer by Verizon
I collaborated with Verizon as lead user experience and interface designer for the Network Topology Visualizer (NTV)—a robust application and user interface built to visualize and manage complex network infrastructures. Designed for IT analysts, DevOps teams, CIOs, and other decision-makers, NTV leverages Verizon’s industry-leading network backbone to help users discover, explore, and resolve network issues with greater speed and clarity across the U.S.
A core goal of the project was to unify multiple telecommunications tools into one cohesive, intuitive experience—delivering a true “single pane of glass” interface that streamlines workflows and enhances operational efficiency.
Landing page visual design

Watch the video demo below
UX research
We began the project with a multi-phase interview process, engaging closely with the core engineering team and SMEs to gain a deep understanding of existing workflows and gather detailed technical and functional requirements. Our approach centered on crafting clear job stories that aligned user needs with business objectives, helping us define key goals, success metrics (KPIs), and identify pain points or inefficiencies in the current system.
The discovery phase was essential in understanding how users interact with complex telecommunications infrastructures. Through this process, we explored how the application could support critical tasks such as monitoring, alerting, investigating, and reporting on network events and anomalies. Additionally, we focused on surfacing actionable insights that would inform strategic decisions related to connectivity, load balancing, and overall network performance.
User Persona Development
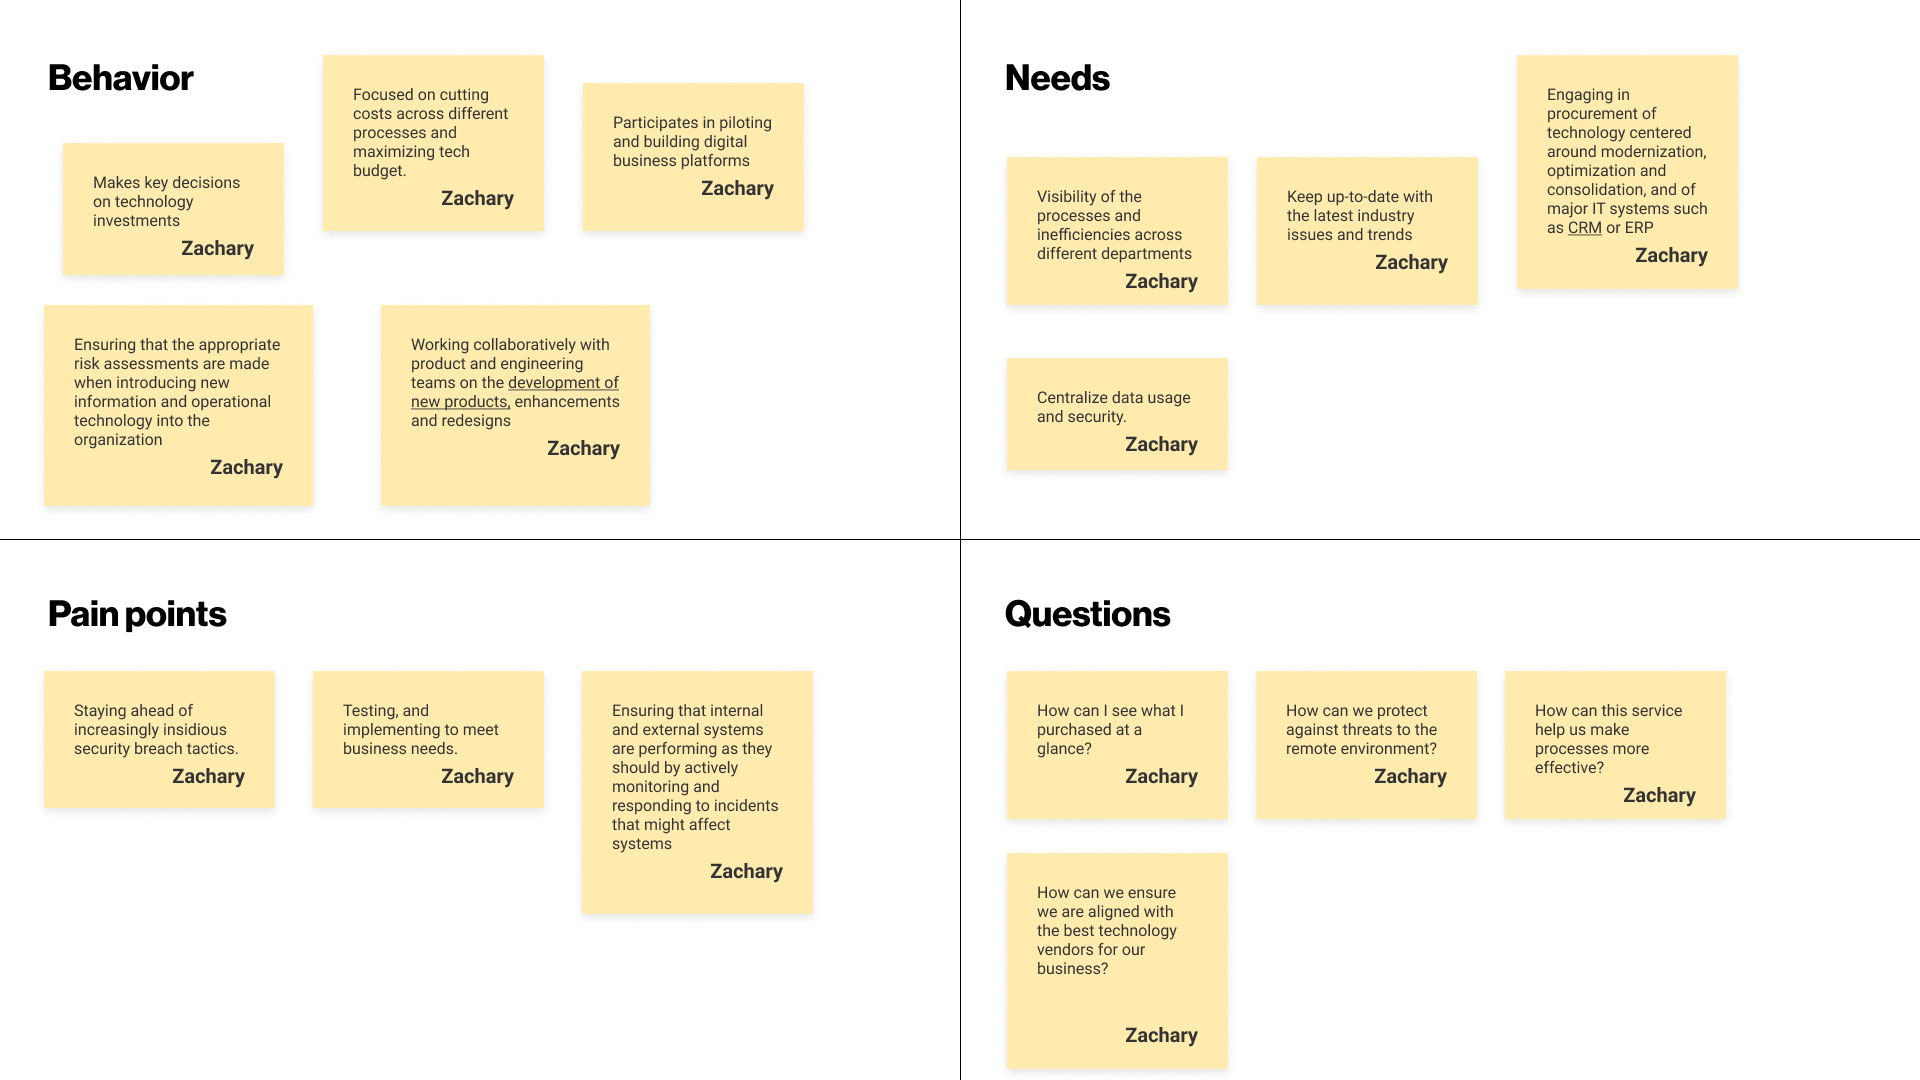
We conducted a thorough landscape analysis to see what competitors were doing to solve similar problems for end users. We also conducted client interviews and in-depth weekly walkthroughs in current systems to uncover common DevOps, cloud engineers, and CIO/CTO tasks, goals, needs, and pain points. Here are some of the resources we relied on, along with internal business conversations, to understand and hone in on the proto-persona.

Josh AdamsCloud Support Engineer and DevOps Analyst
Technological proficiency
- Expert
- Azure Database admin, or web apps services.
Biography for Cloud Support Engineering:
Josh is the point of contact to solve cloud related issues, and more like the manager of the ticket, managing a team of experts to help resolve issues.
Needs:
- System proactively finds and resolves issues
- Reduce time spent troubleshooting
- Suggests remediation steps
- Health scores and actionable insights
Pain points:
- 90% of the time does not know the solution
- Needs to respond within 1hr, preferably 15 mins
- Has a lot of monitors, remote or on site, and screen real estate is valuable
Goals:
- Minimize time configuring devices
- Minimize time troubleshooting issues
- Conduct in-depth research
- Recreate the customer’s environment to resolve
- Manage ticket effectively
UI design
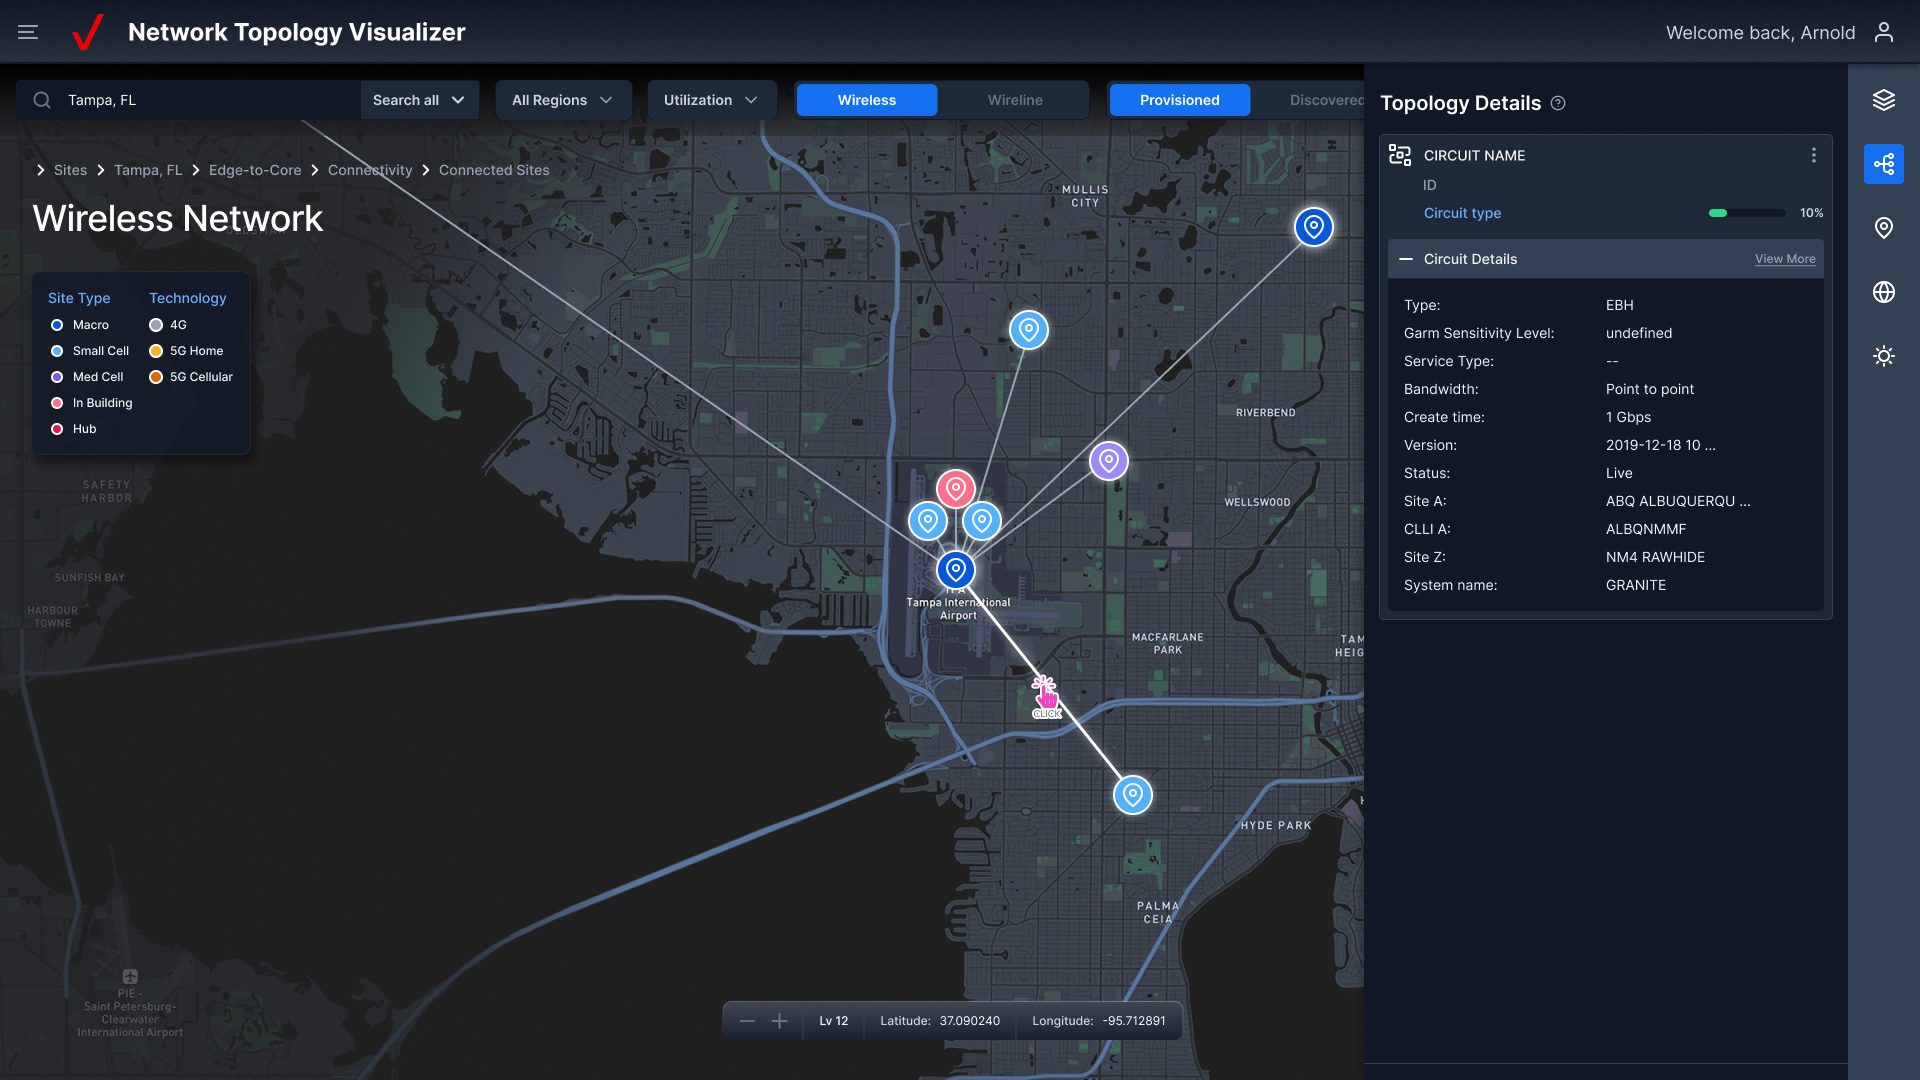
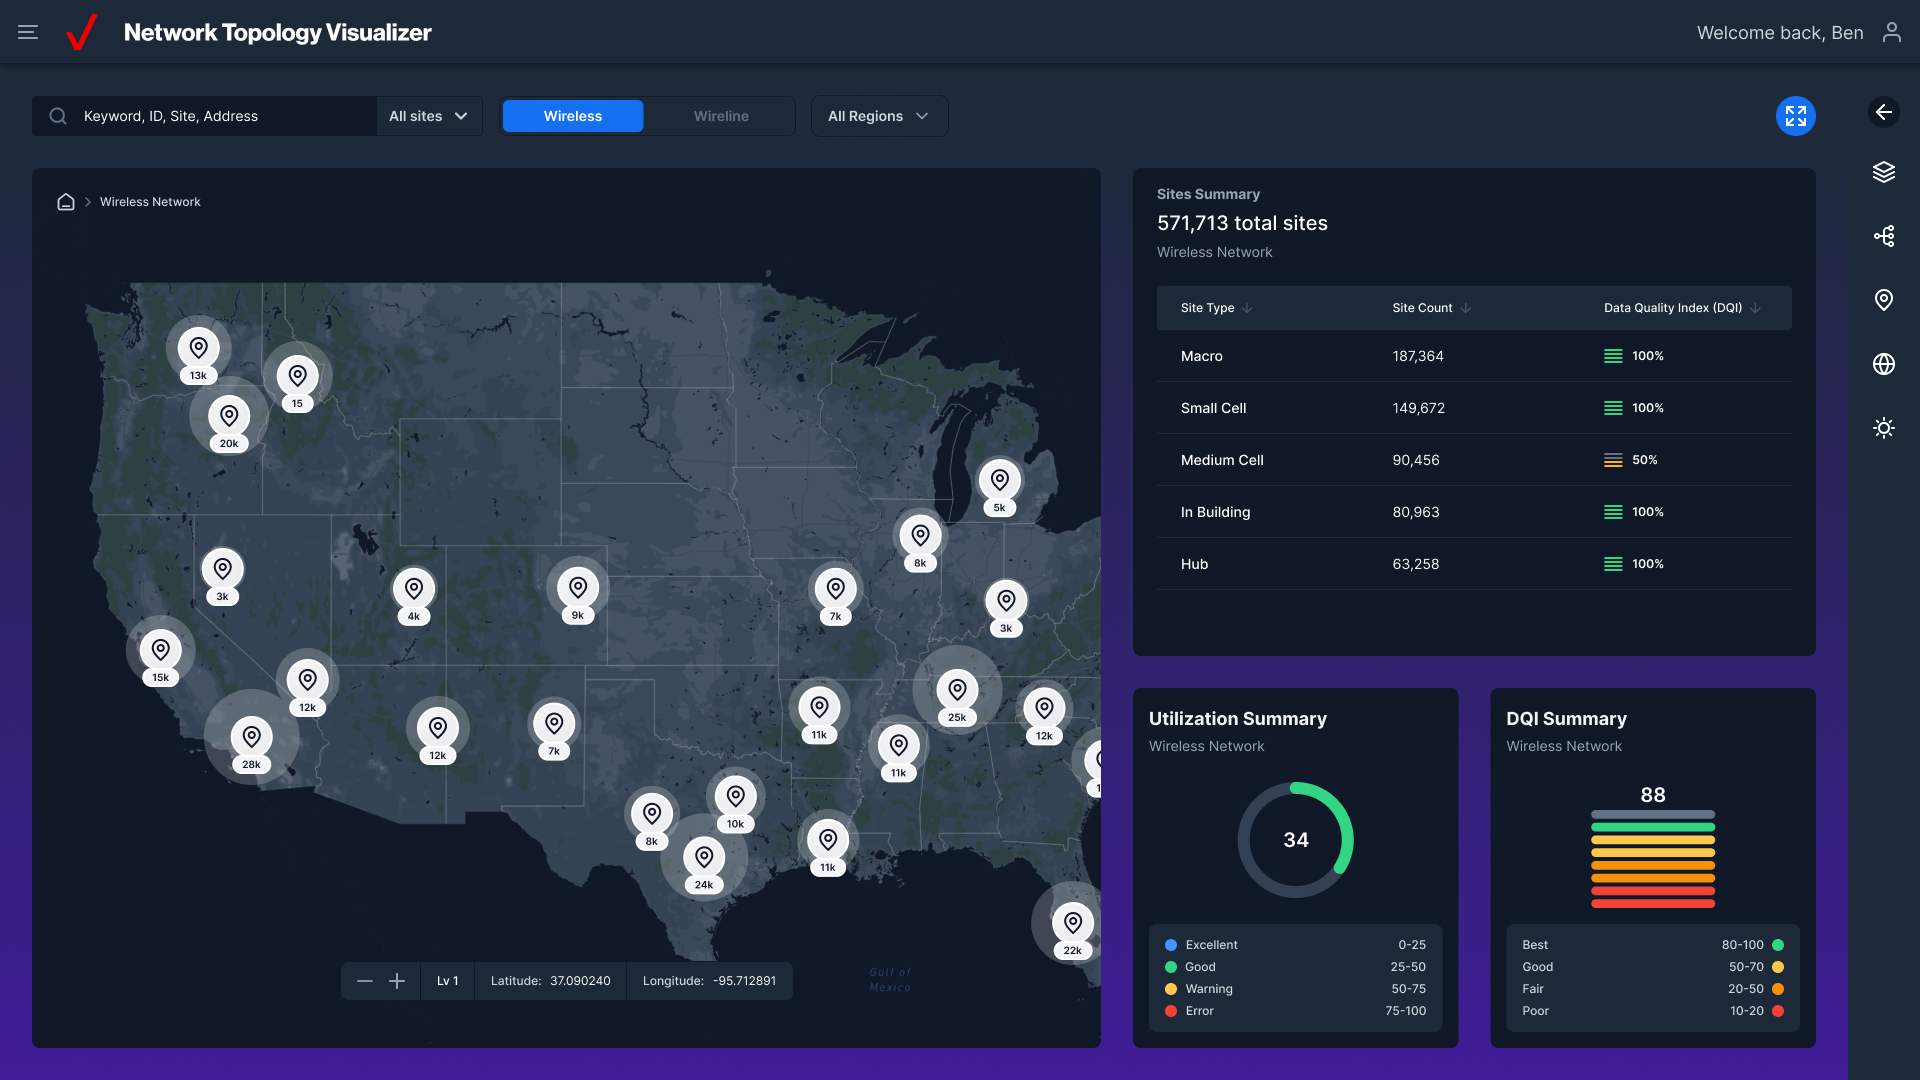
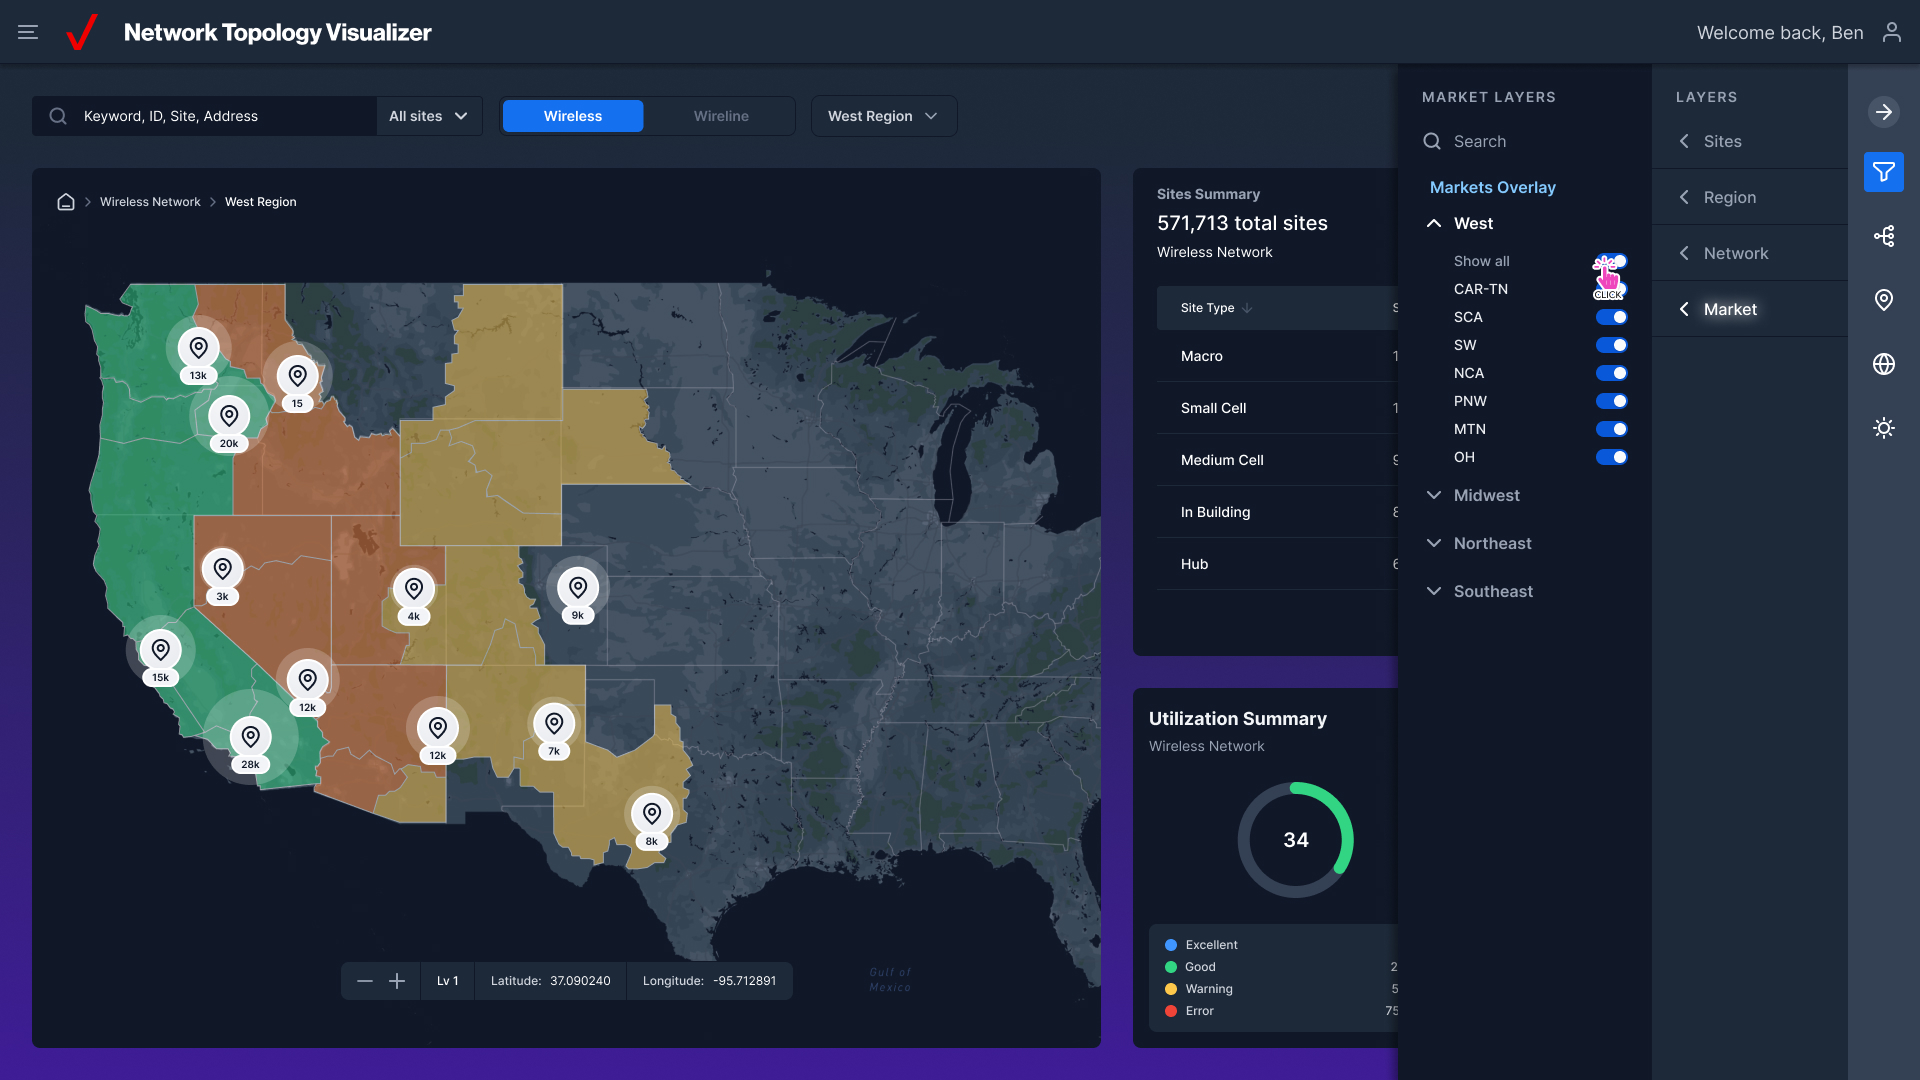
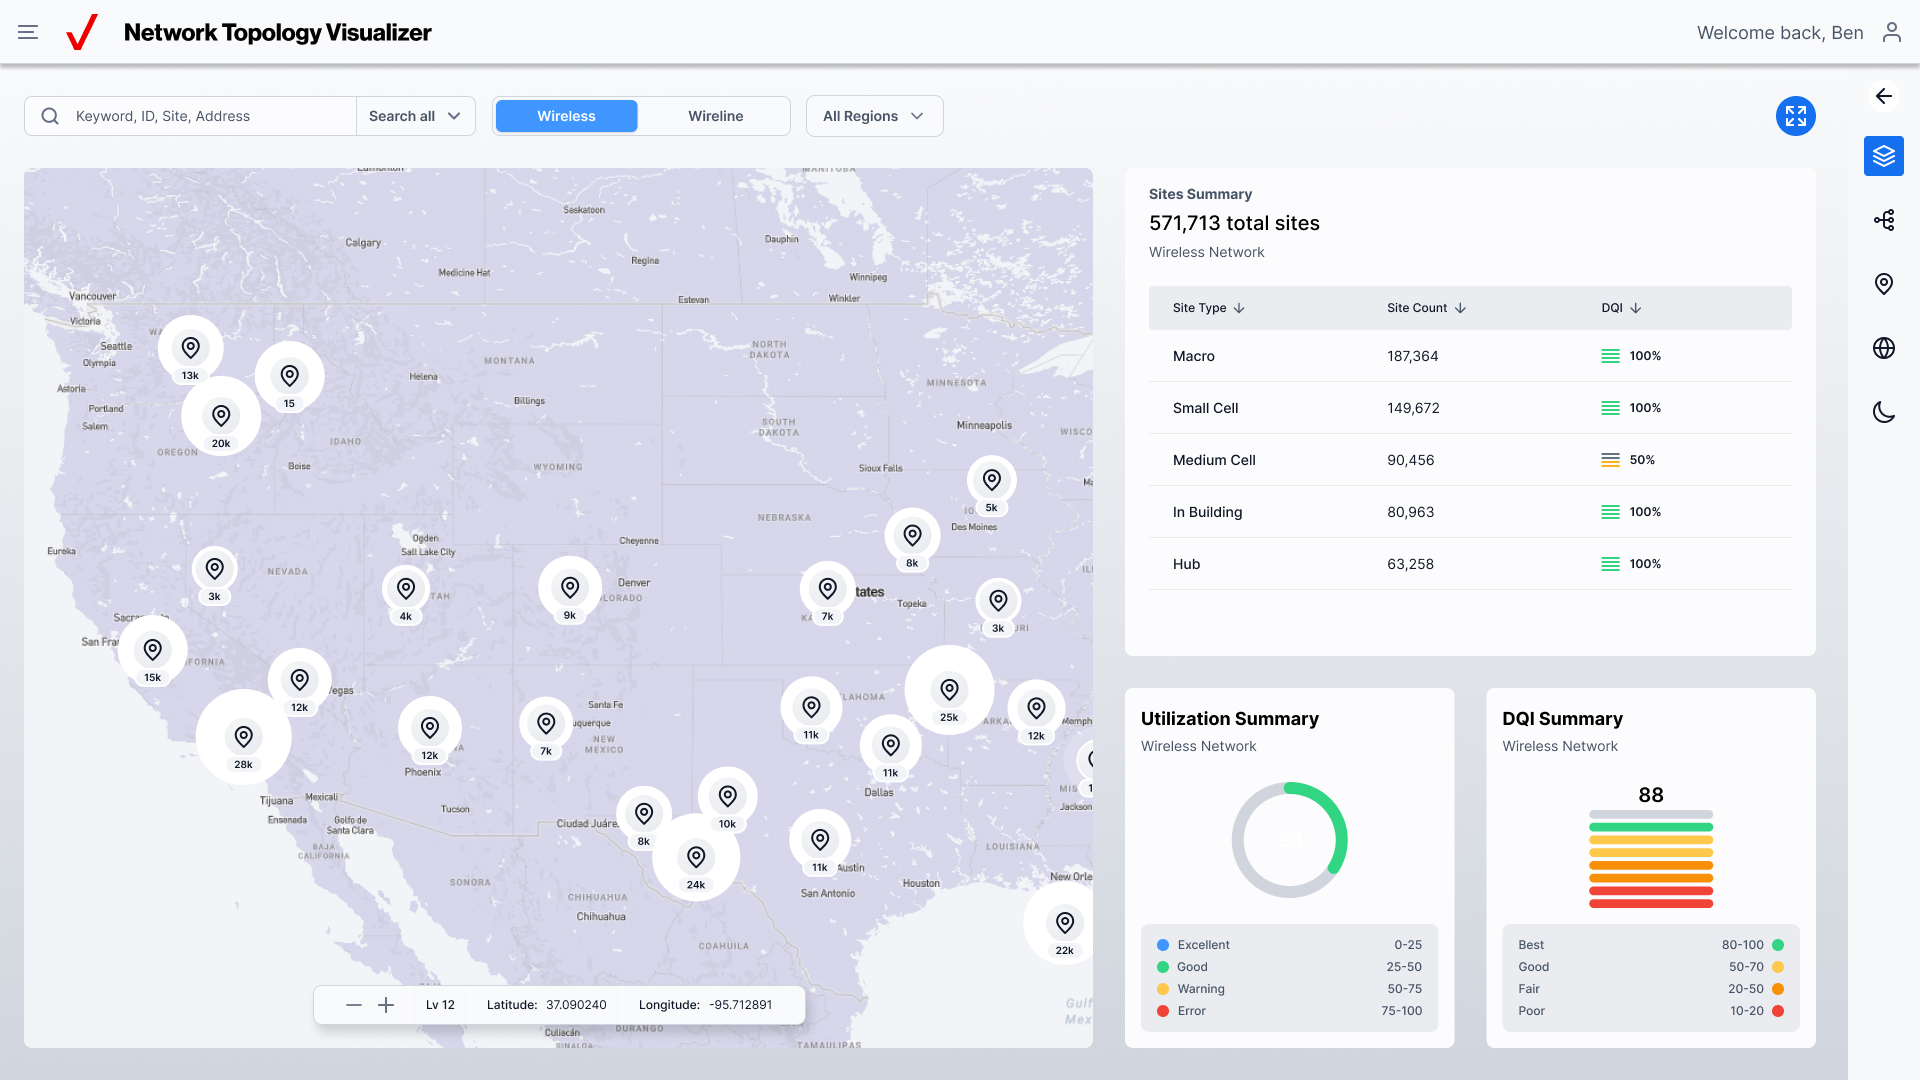
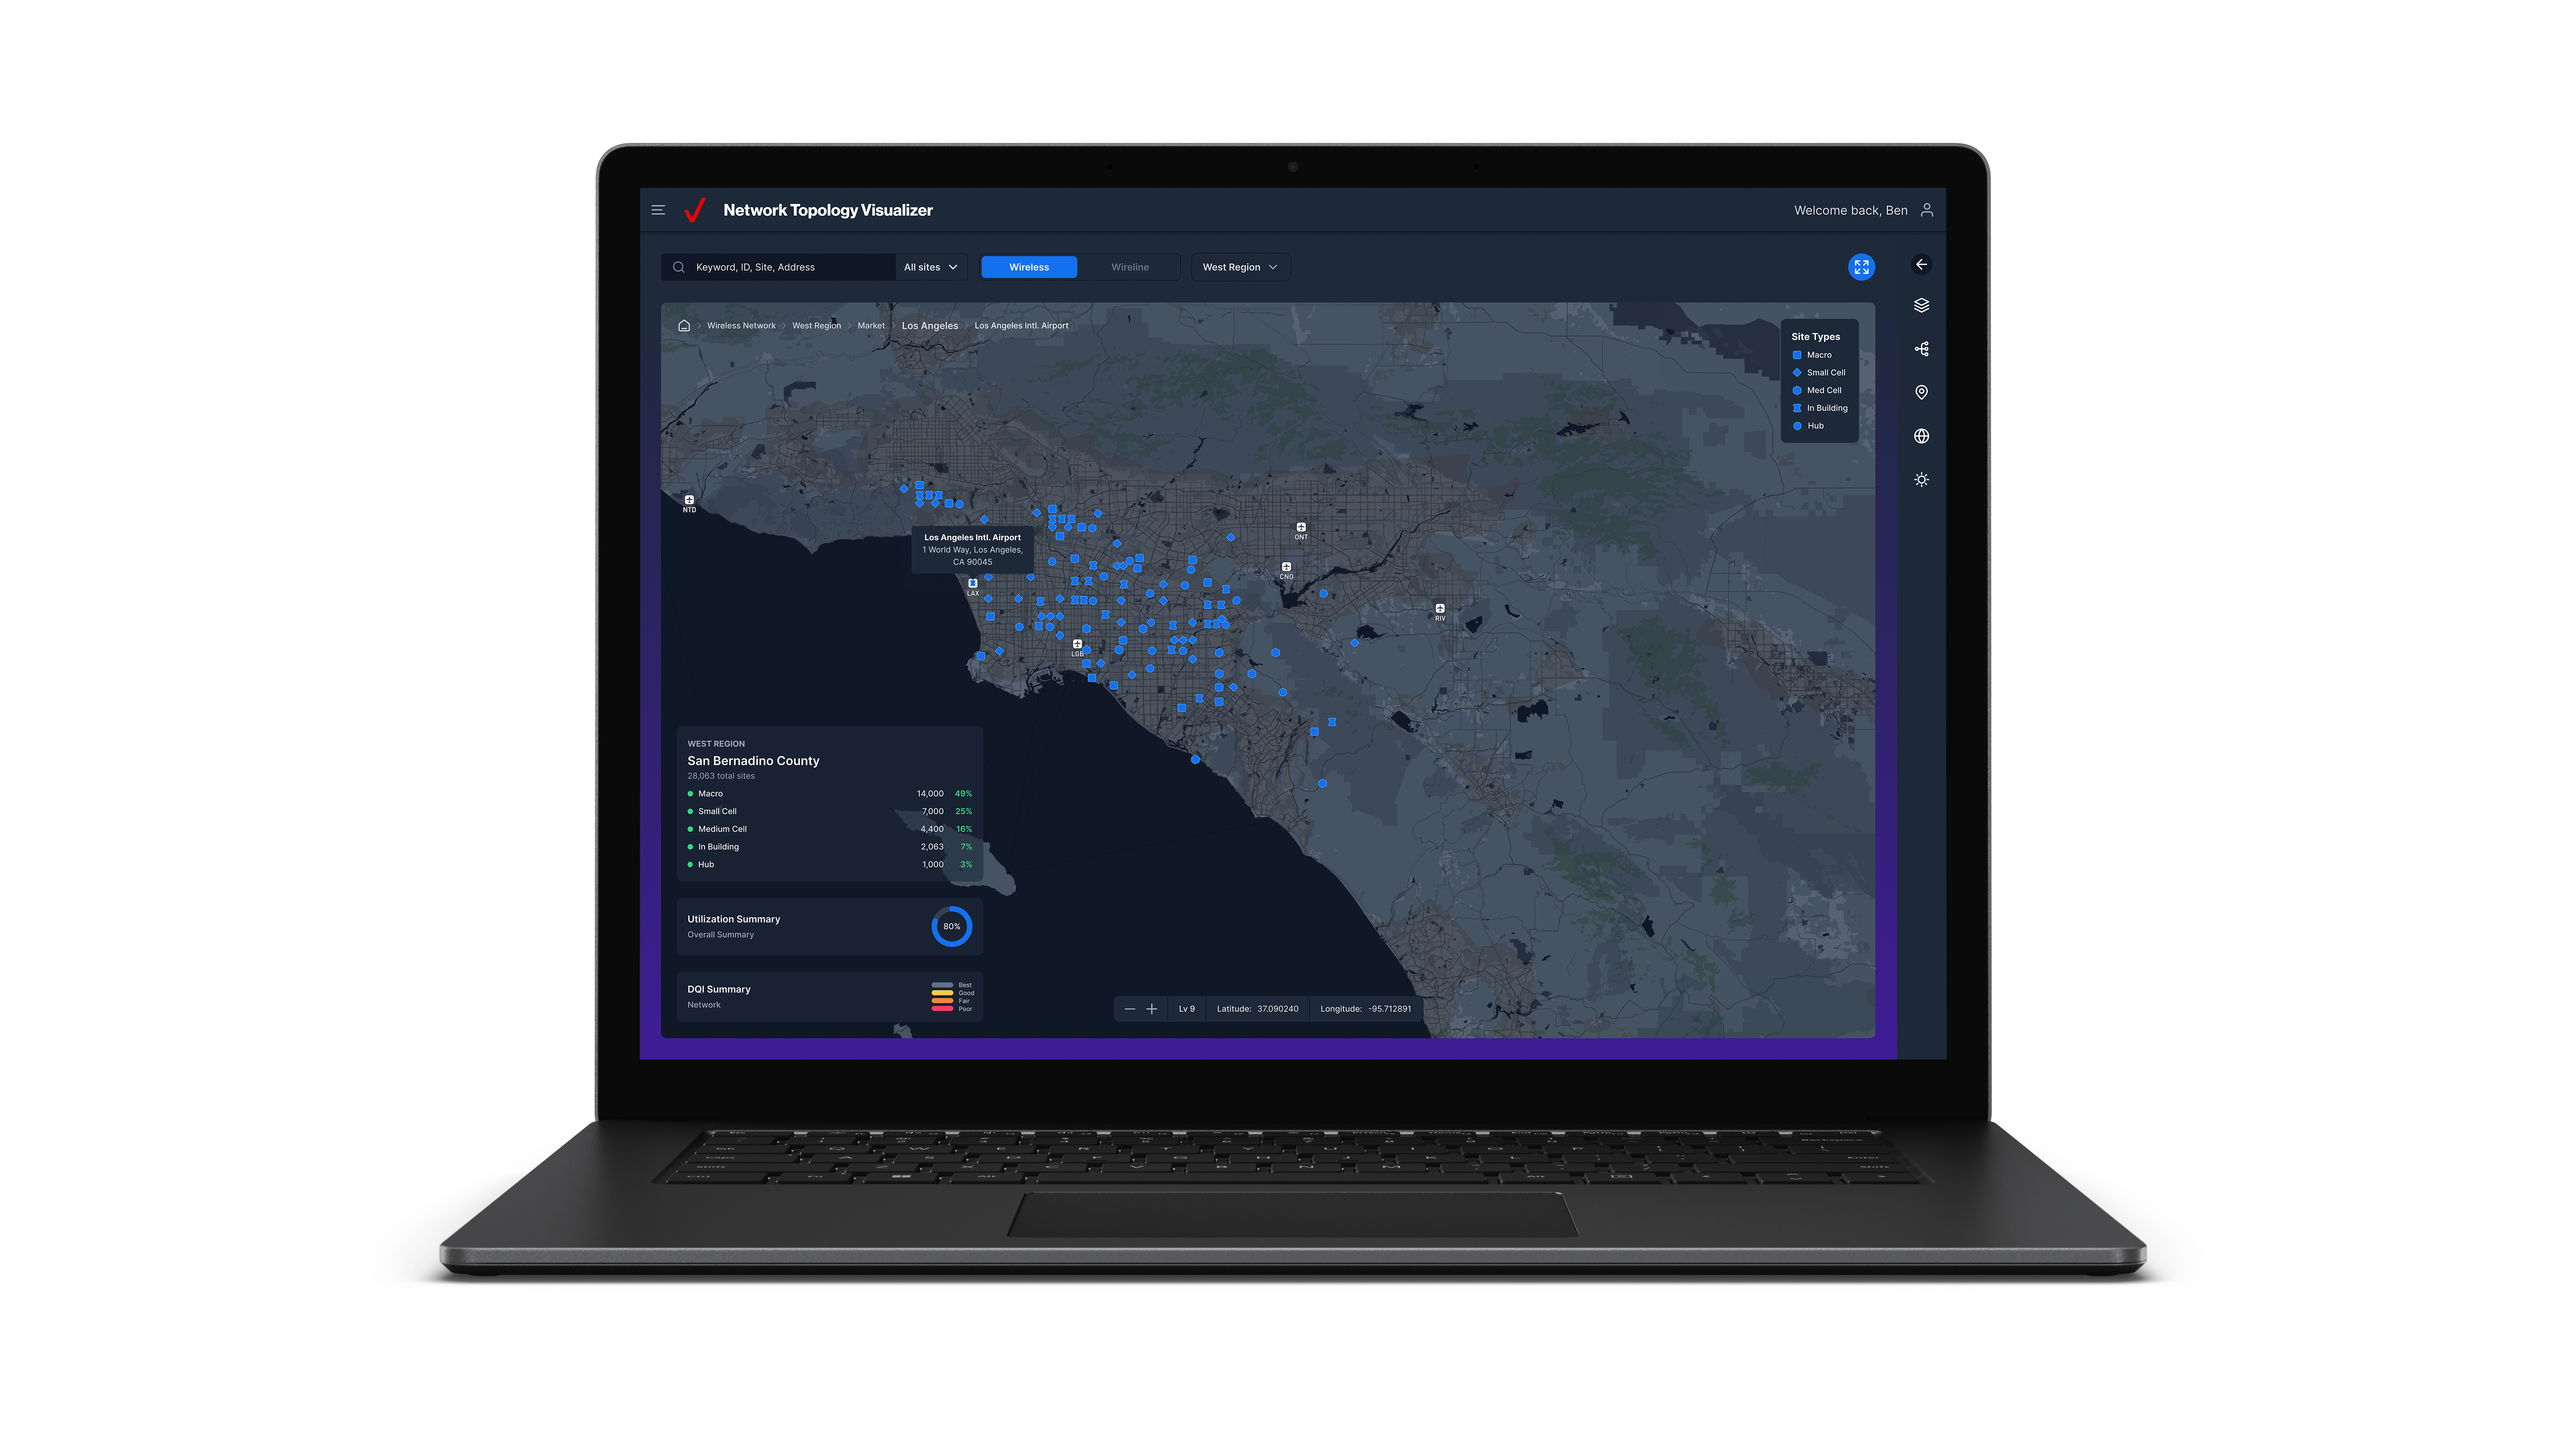
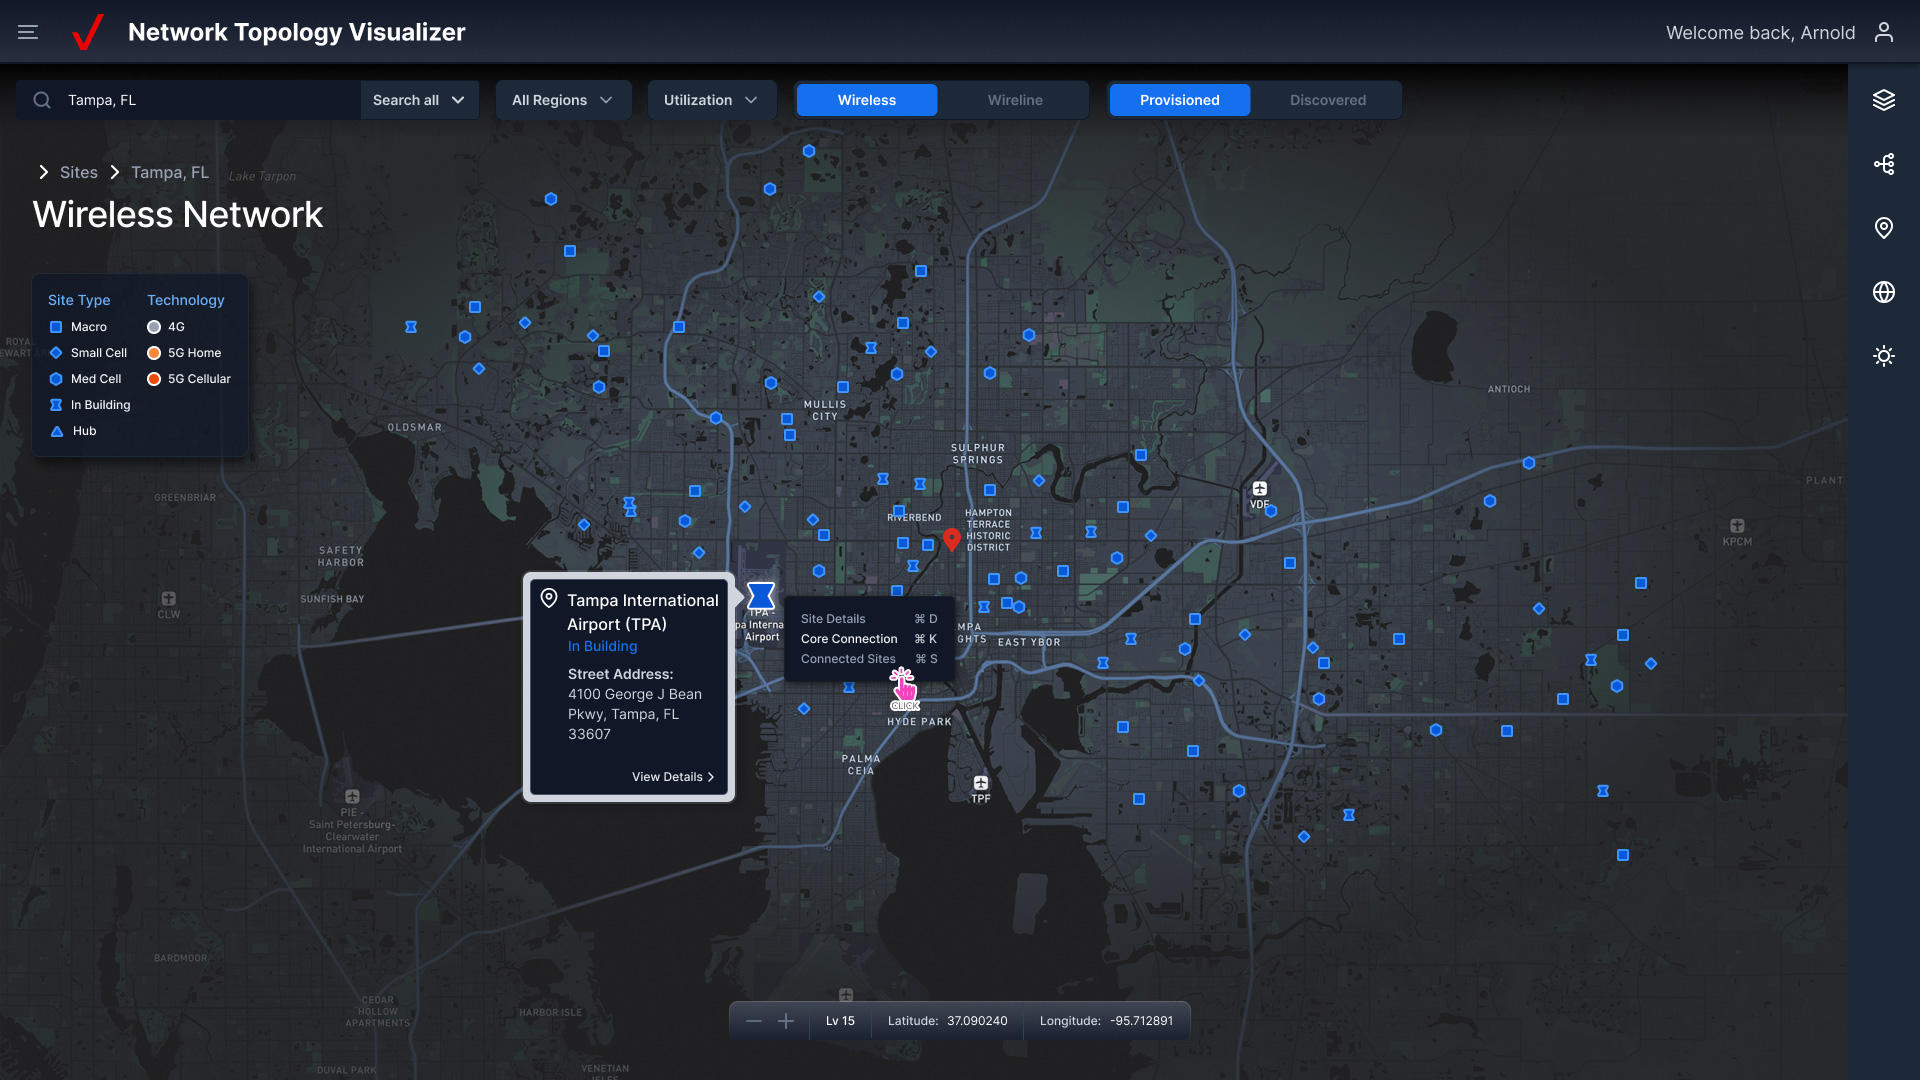
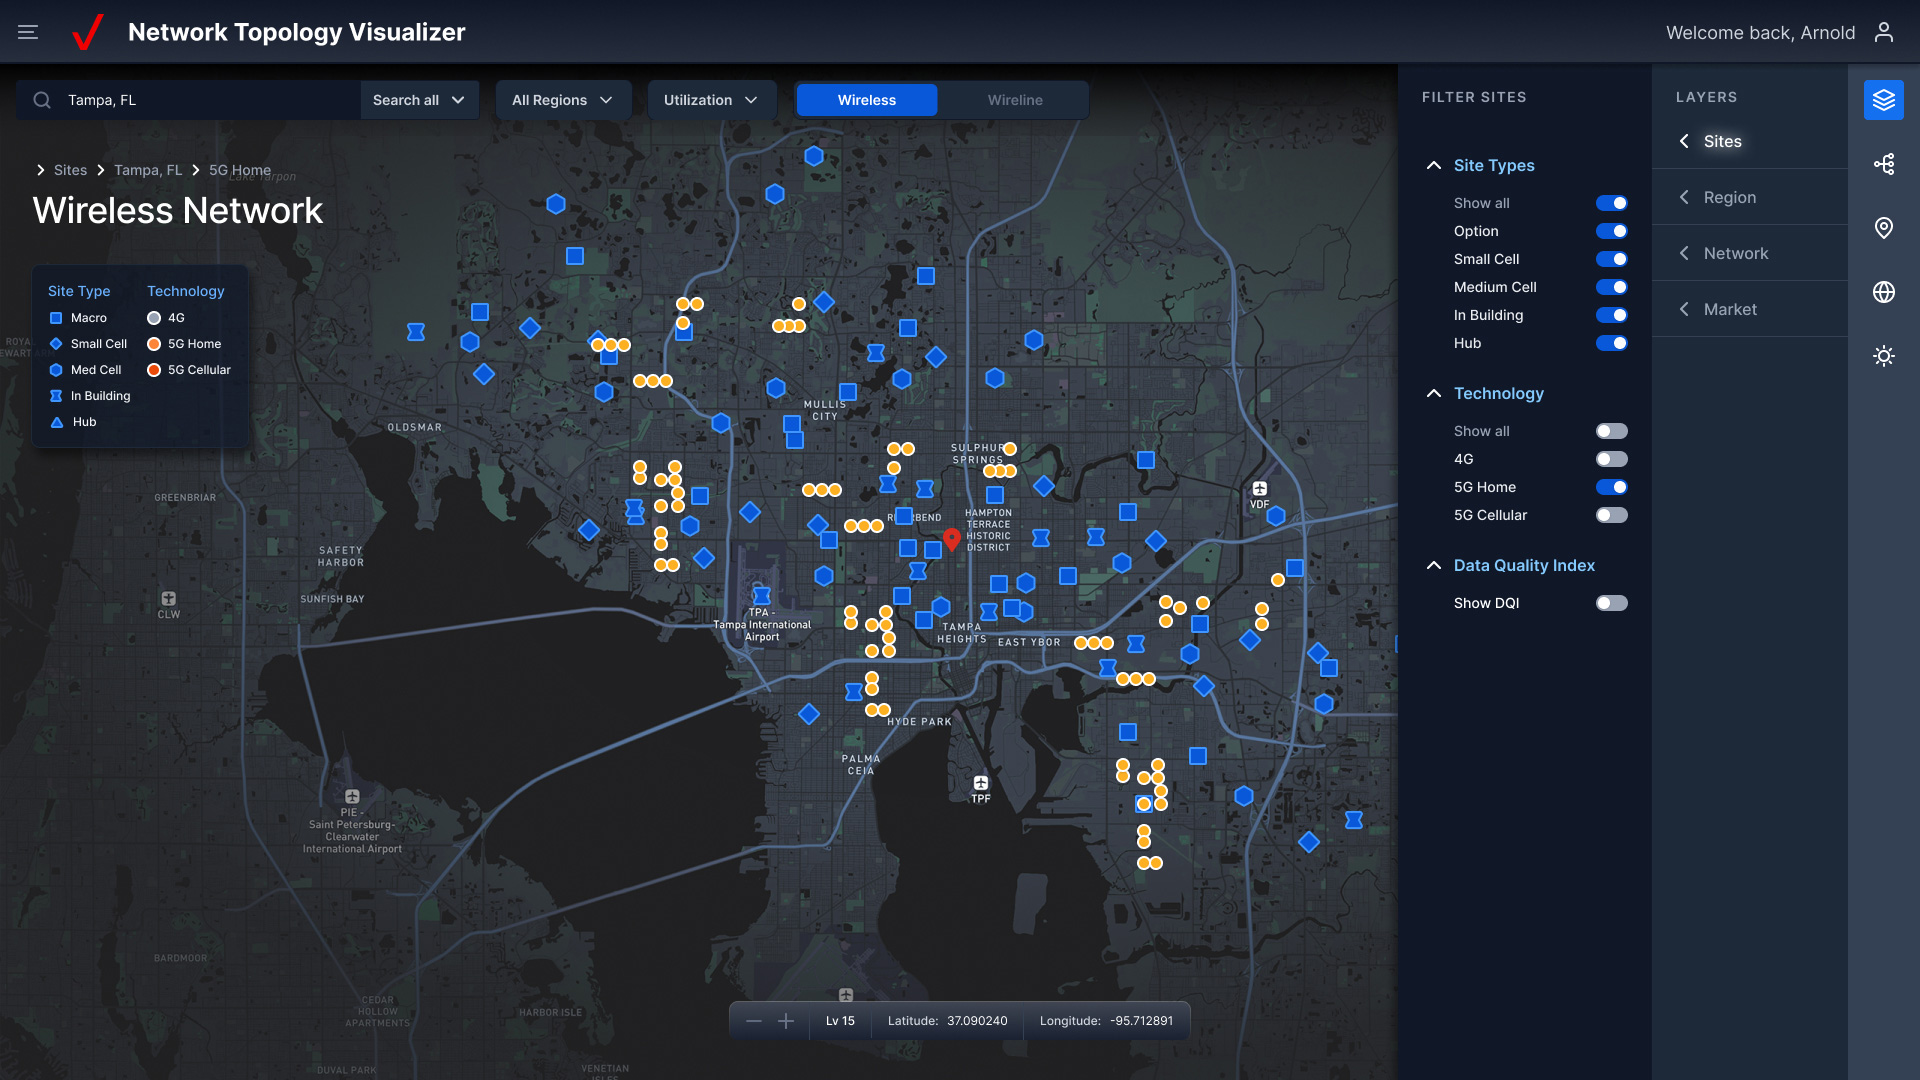
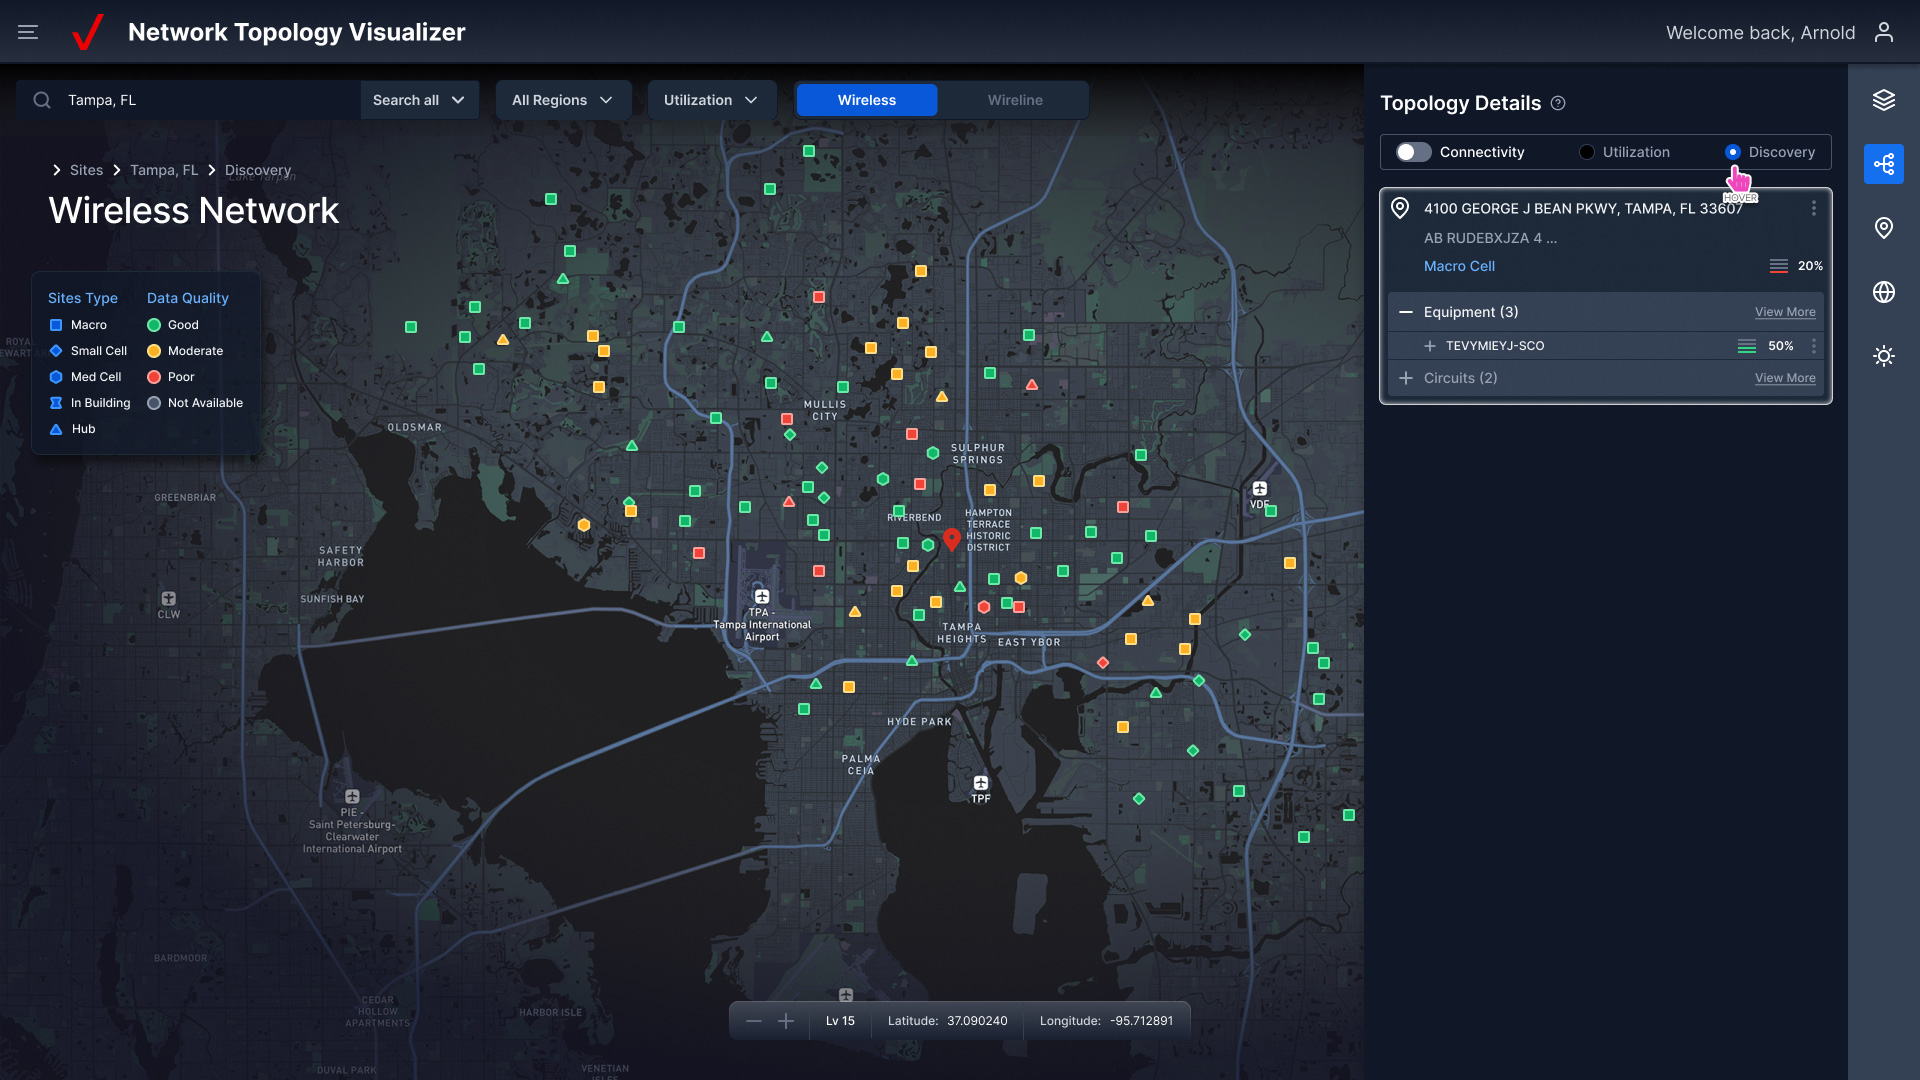
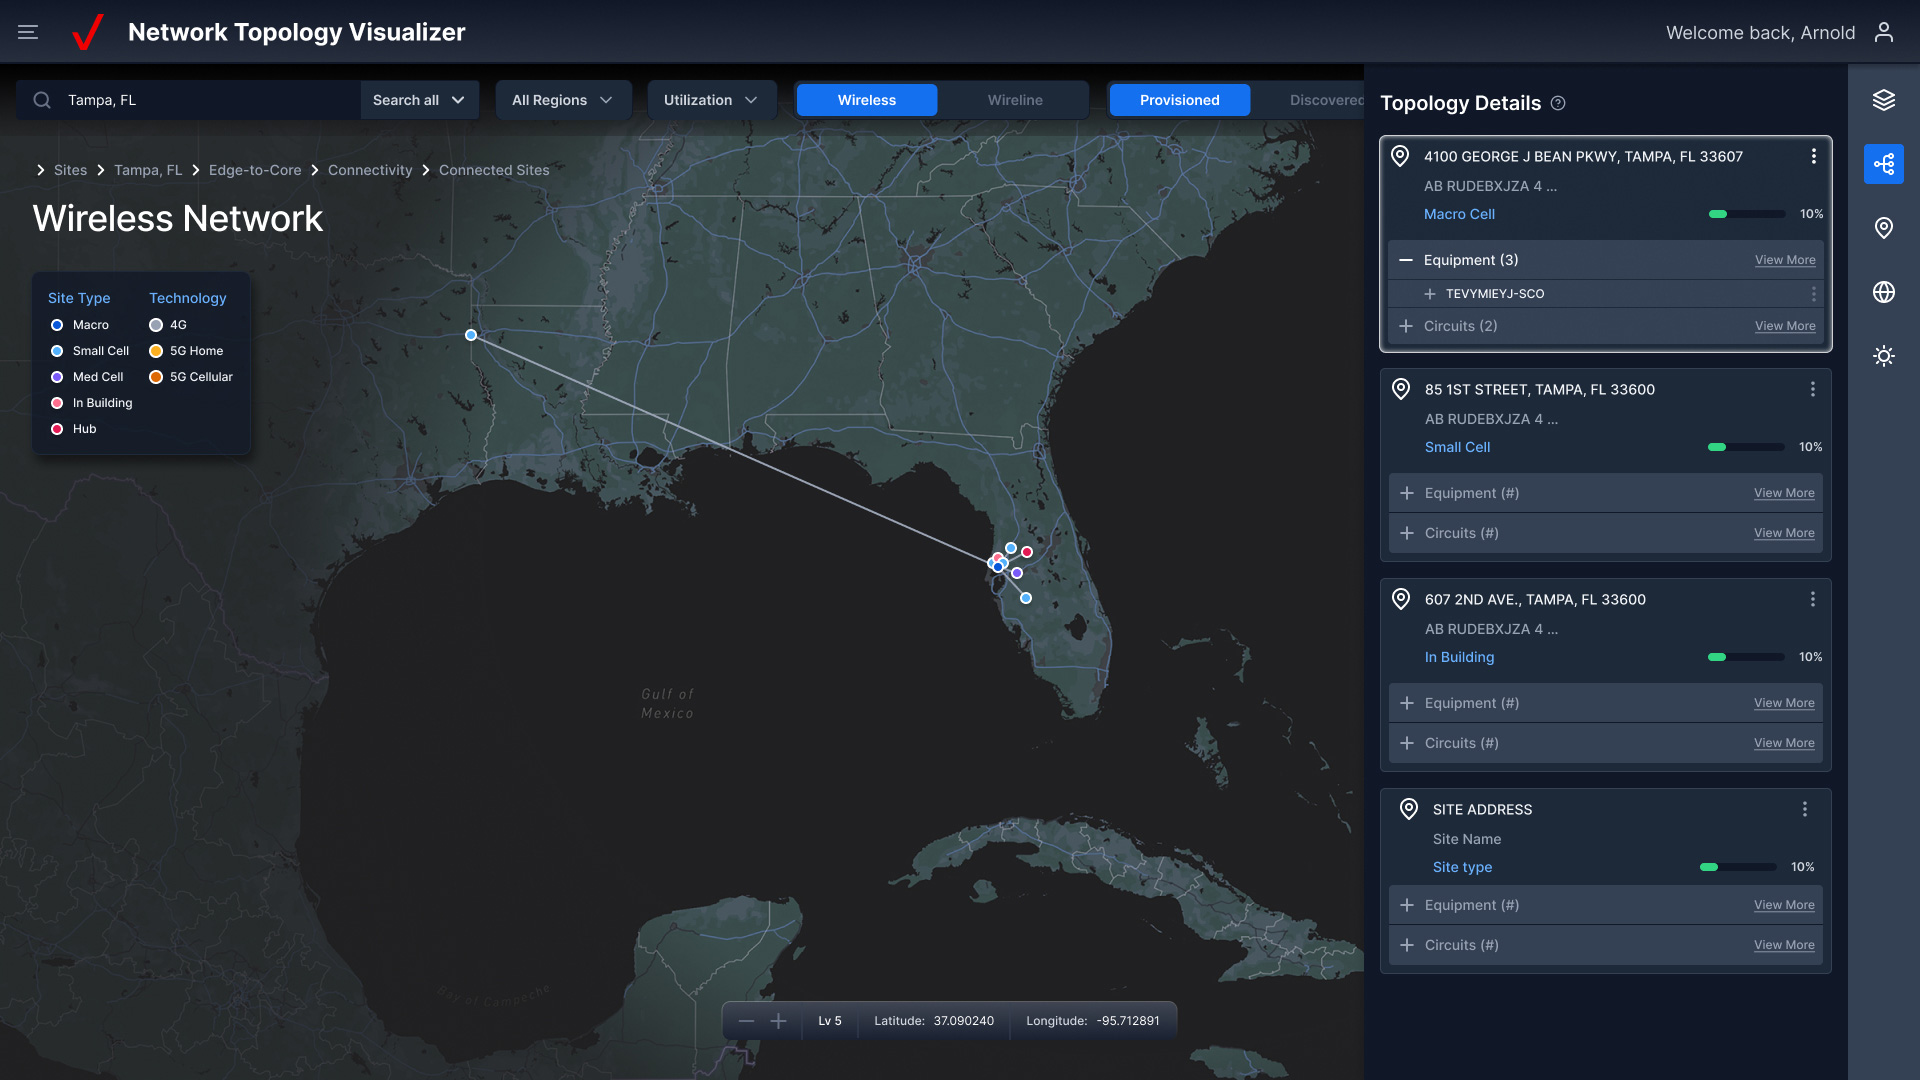
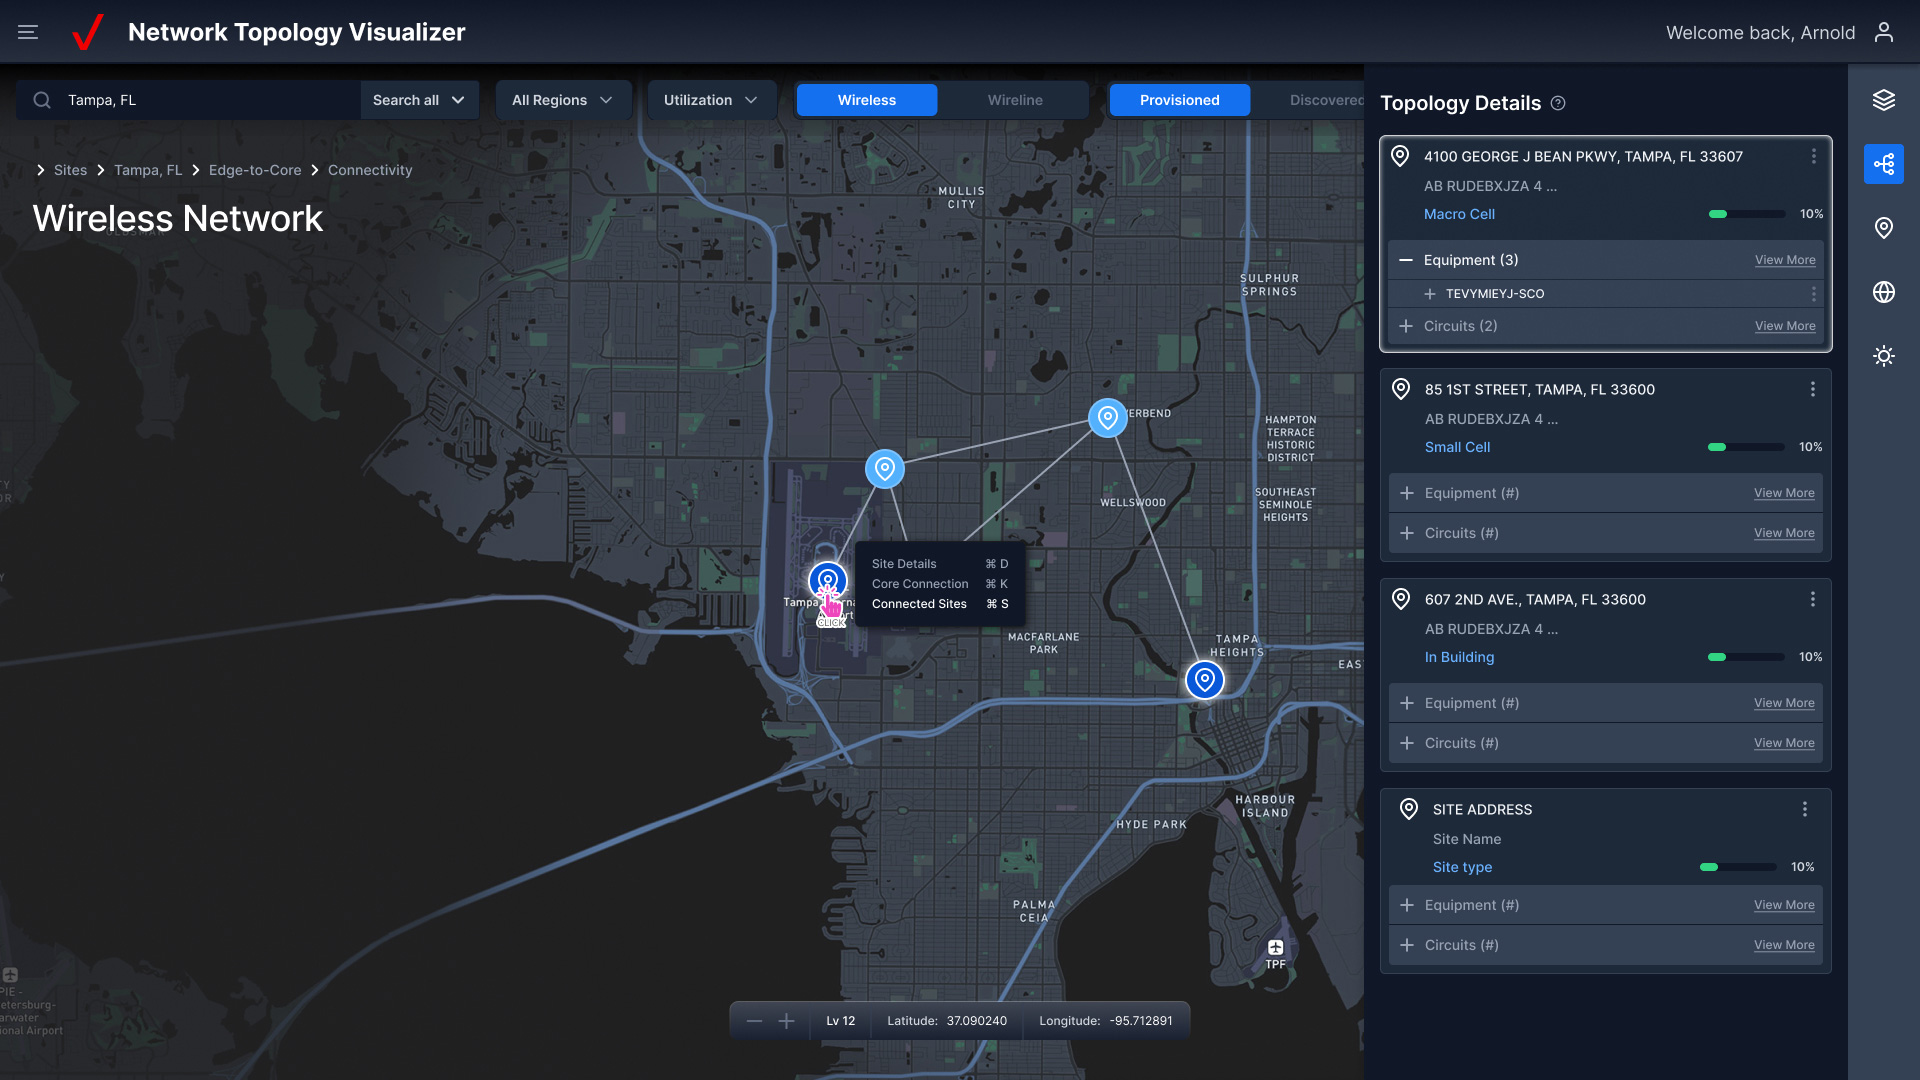
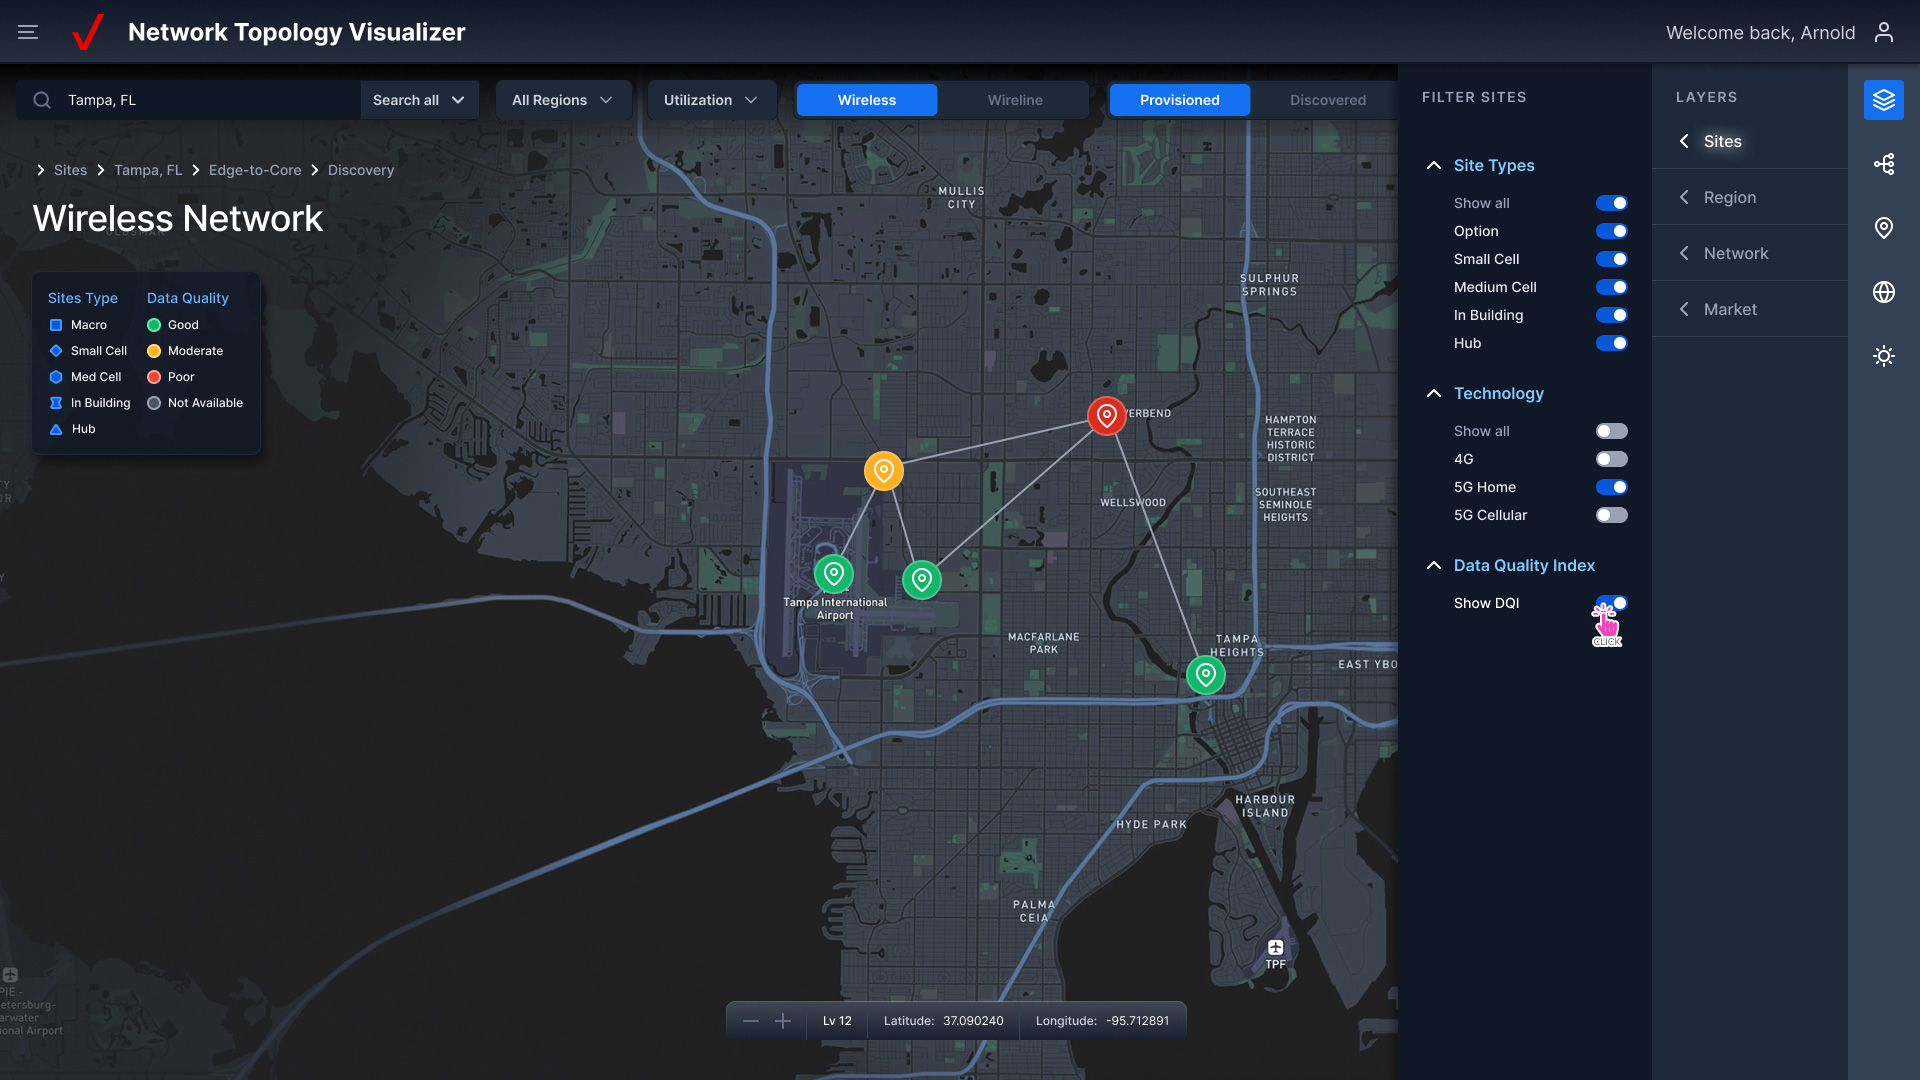
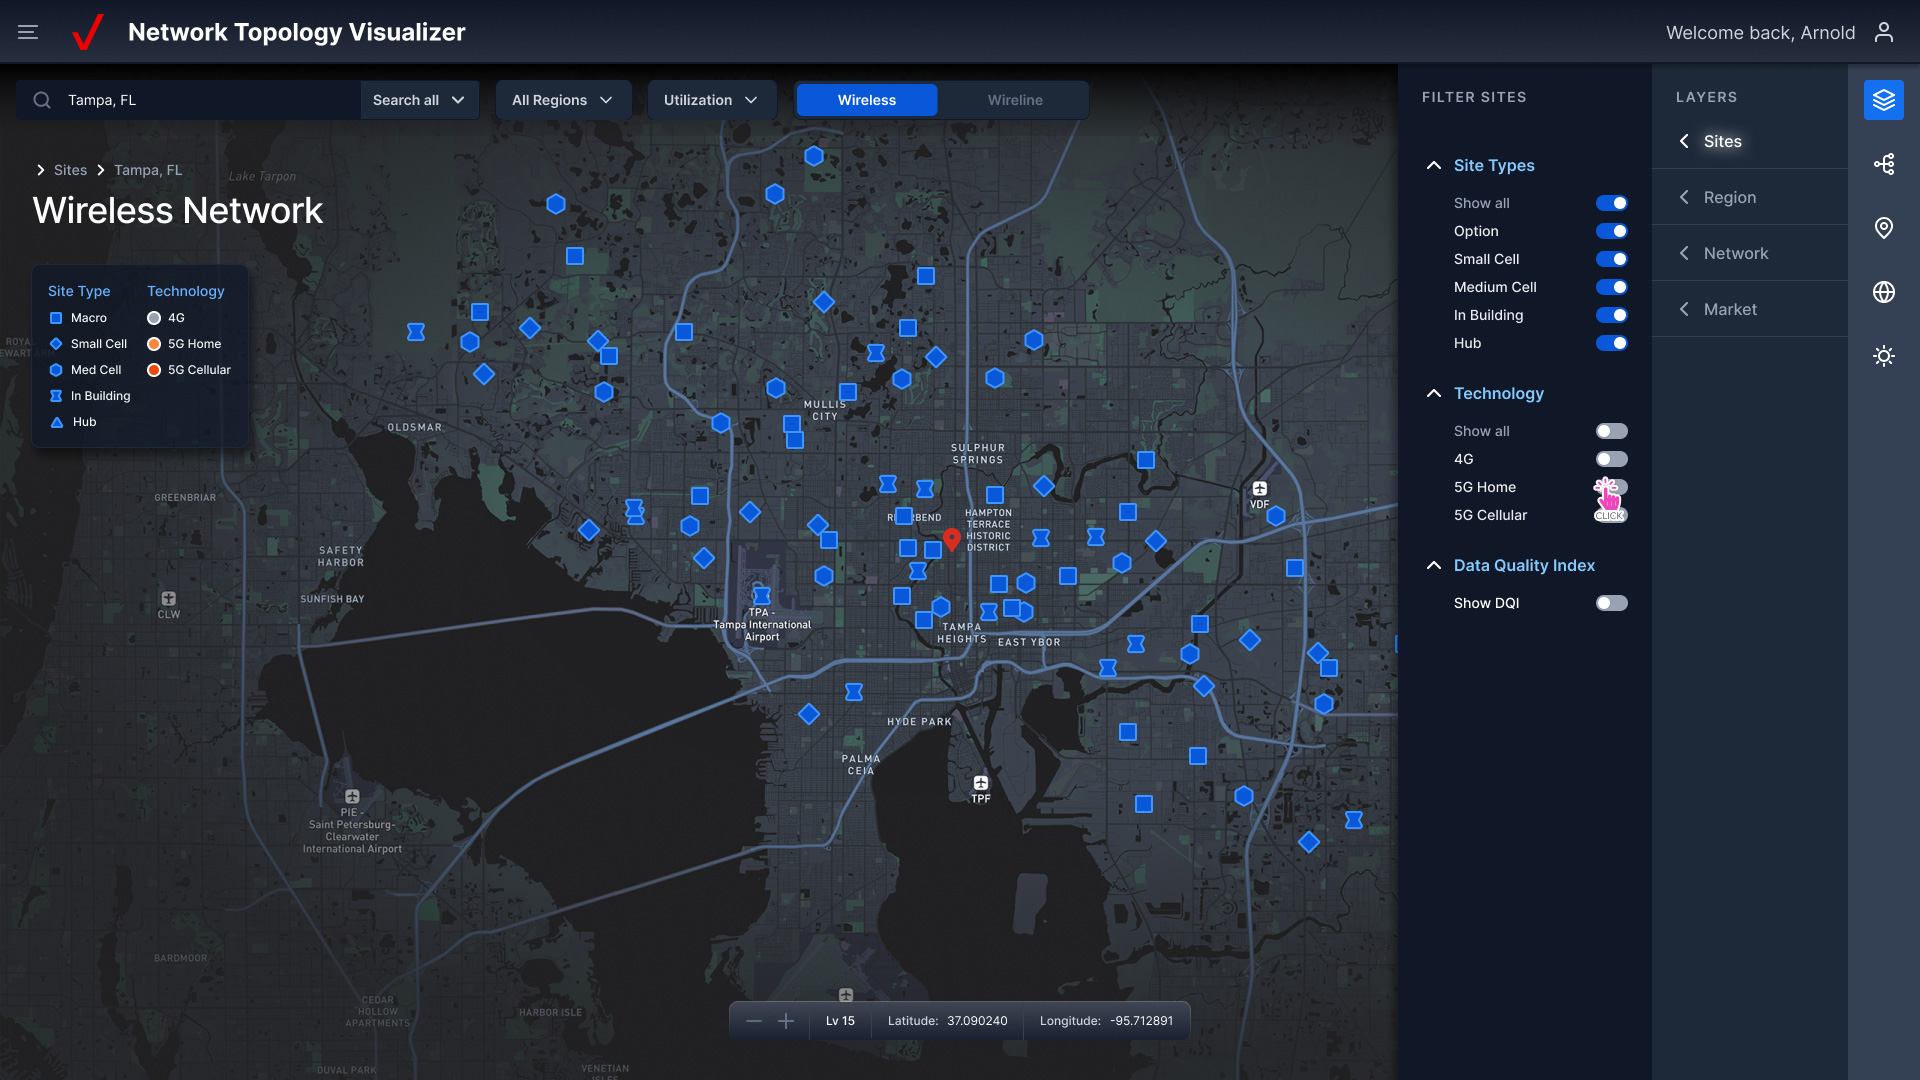
The discovery phase was essential to the interface design. It was imperative to understand how users interact with complex telecommunications infrastructures and their incentives. Through this process, we explored how the application interface could support critical tasks such as complex, layer-based monitoring, analysis, and reporting for network events and anomalies. Additionally, we focused on system feedback and alerts that help users via actionable insights that inform strategic decision making related to connectivity, load balancing, overall network configuration, and performance. We also included dark and light mode interface skins.
Below are a selection of dashboard screens that showcase the interface design.